
A statistics calculator summarizes a list of numbers with its count, mean, median, minimum, maximum and standard deviation. Formula: Mean = sum/n. Median from sorted list. Sample SD = sqrt(SS/(n-1)) for n>1 (else SS/1). For 2, 4, 4, 4, 5, 5, 7, 9 the mean is 5 and the median is 4.5.
On this page
How to use the statistics calculator
- Enter your numbers separated by commas or spaces.
- Read the count, mean, median, minimum, maximum and sample standard deviation.
How the statistics calculator works
The statistics calculator gives a quick summary of a list of numbers. Enter values separated by commas or spaces and it reports:
- Count: how many values there are
- Mean: the sum divided by the count
- Median: the middle value after sorting, or the average of the two middle values
- Minimum and maximum
- Sample standard deviation, using n − 1
Results show up to 4 decimal places.
Statistics calculator worked example
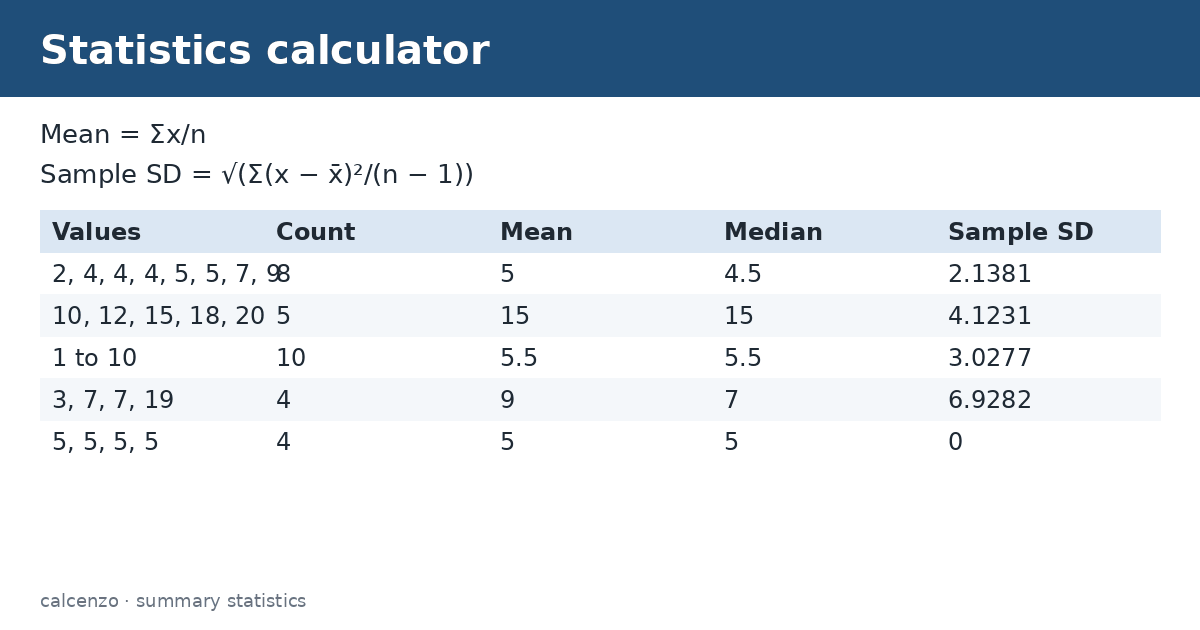
Enter 2, 4, 4, 4, 5, 5, 7, 9. The count is 8 and the sum is 40, so the mean is 5. Sorted, the middle two values are 4 and 5, so the median is 4.5. The minimum is 2 and the maximum is 9. The squared deviations add to 32, and √(32 ÷ 7) ≈ 2.1381, the sample standard deviation. The statistics calculator shows all six figures at once.
| Values | Count | Mean | Median | Sample SD |
|---|---|---|---|---|
| 2, 4, 4, 4, 5, 5, 7, 9 | 8 | 5 | 4.5 | 2.1381 |
| 10, 12, 15, 18, 20 | 5 | 15 | 15 | 4.1231 |
| 1 to 10 | 10 | 5.5 | 5.5 | 3.0277 |
| 3, 7, 7, 19 | 4 | 9 | 7 | 6.9282 |
| 5, 5, 5, 5 | 4 | 5 | 5 | 0 |
Mean versus median
The mean uses every value, so a few large numbers pull it up. The median only depends on the middle, so it resists extremes. In the list 3, 7, 7, 19 the mean is 9 but the median is 7, because 19 pulls the mean to the right. When the mean is greater than the median, the data is usually skewed right; when it is smaller, skewed left. Income and house prices are often reported as medians for this reason.
Measuring spread
The range, maximum minus minimum, is the simplest measure of spread: 9 − 2 = 7 in the example. The standard deviation is more informative because it uses every value. The tool reports the sample version; for a whole population, divide by n instead, which gives 2.0 for the example list. Use the standard deviation calculator if you need the population figure directly.
Mode and other measures
The mode, the most frequent value, is 4 in the example. This tool does not show it; the mean median mode range calculator does. Quartiles, percentiles and the interquartile range are also useful summaries for skewed data.
Single values and bad input
With only one value the sample standard deviation is undefined, so the tool shows “n/a” for it. Entries that are not numbers are left out and listed under “Ignored”, so you can see what was dropped. Thousands separators such as 1,200 work when values are separated by spaces, semicolons or new lines.
Using a summary
A summary is the first step in understanding data. Before running tests or drawing charts, look at the count, center and spread, and check that the minimum and maximum make sense. An impossible value, such as a negative age, usually means a data entry error that you should fix before further analysis.
A second example
Here is another run of the statistics calculator. Daily high temperatures for a week of 68, 71, 70, 75, 73, 69 and 72 degrees give a count of 7, a mean of 71, a median of 71, a minimum of 68 and a maximum of 75. The sample standard deviation is about 2.4, so most days were within a few degrees of the average. Equal mean and median suggest the week was fairly symmetric. Running a statistics calculator on each week makes them easy to compare.
Tips
- Compare the mean and the median to spot skew.
- Check the minimum and maximum for errors.
- Use at least two values for a standard deviation.
- Paste data straight from a spreadsheet column.
Related converters and calculators
Related calculators:
- Standard deviation calculator: spread
- Z-score calculator: standard scores
- Confidence interval calculator: estimates
- Percentage calculator: percents
Sources
NIST/SEMATECH e-Handbook: Measures of location; OpenStax Introductory Statistics 2e, 2.6: Skewness and the mean, median and mode; NIST/SEMATECH e-Handbook: Measures of scale.
Formula and method
Mean = sum/n. Median from sorted list. Sample SD = sqrt(SS/(n-1)) for n>1 (else SS/1).
Descriptive summary only. Sample SD uses n-1 when n>1.
Questions about this calculator
What does it calculate?
Count, mean, median, min, max and sample standard deviation.
How is the median found?
The middle sorted value, or the average of the two middle values.
Is the standard deviation sample or population?
Sample, dividing by n − 1.
Does it show the mode?
No.
Why are some values ignored?
Non-numeric entries are skipped.
Check the assumptions and units before relying on a result. Financial, tax and health estimates do not replace advice for your individual circumstances.
Report a calculation issue