
A p-value calculator turns a z-score into the probability of a result at least that extreme under the null hypothesis. z = 1.96 gives a two-tailed p of 0.05.
On this page
How to use the p-value calculator
- Enter the z-score.
- Choose two-tailed, left-tailed or right-tailed.
- Read the p-value.
How the p-value calculator works
The p-value calculator converts a z-score from a test statistic into a p-value using the standard normal distribution. For a two-tailed test, p = 2 × (1 − Φ(|z|)), where Φ is the normal cumulative distribution function. For a left-tailed test p = Φ(z), and for a right-tailed test p = 1 − Φ(z). It evaluates Φ with a double-precision algorithm (Hart, as described by West) accurate to about 10⁻¹⁴, and shows very small p-values in scientific notation.
P-value calculator worked example
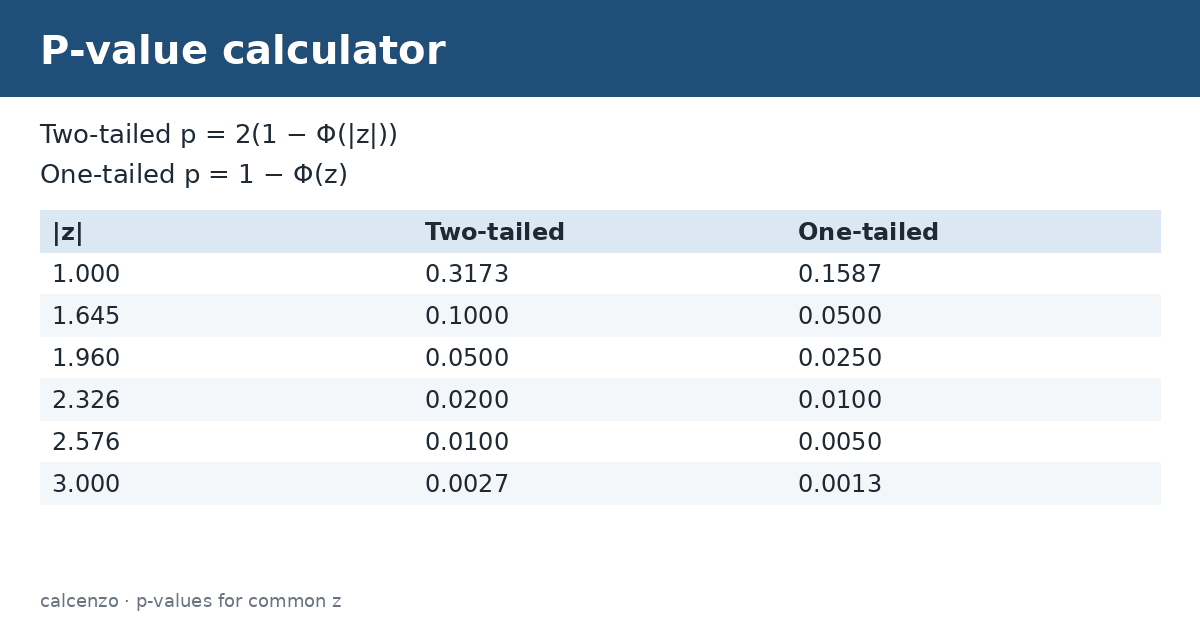
A test gives z = 1.96. The p-value calculator returns a two-tailed p of 0.0500 and a one-tailed p of 0.0250. At z = 2.576 the two-tailed p is 0.0100. A z of 1.0 gives a two-tailed p of 0.3173, so about a third of samples would be at least that extreme if the null hypothesis were true. The table lists common critical values.
| |z| | Two-tailed p | One-tailed p |
|---|---|---|
| 1.000 | 0.3173 | 0.1587 |
| 1.645 | 0.1000 | 0.0500 |
| 1.960 | 0.0500 | 0.0250 |
| 2.326 | 0.0200 | 0.0100 |
| 2.576 | 0.0100 | 0.0050 |
| 3.000 | 0.0027 | 0.0013 |
What a p-value means
A p-value is the probability of a result at least as extreme as the one observed, assuming the null hypothesis is true. It is not the probability that the null hypothesis is true, and it does not measure the size or importance of an effect. A small p, such as below a pre-chosen significance level of 0.05, means the data would be unusual under the null, so you reject it. A large p means the data are consistent with the null, not that the null is proven.
One-tailed or two-tailed?
Choose the tail before looking at the data. Use two-tailed when a difference in either direction matters, which is the usual default. Use one-tailed only when the hypothesis is clearly directional and an effect in the other direction would be treated the same as no effect. Picking the tail after seeing which way the result went halves the p-value unfairly. The NIST/SEMATECH e-Handbook sets out the steps of a hypothesis test, including stating the alternative first.
When z is the right statistic
Use a z-score when the population standard deviation is known or the sample is large, and for tests of proportions with enough successes and failures. For small samples with an estimated standard deviation, the test statistic follows a t distribution, whose tails are heavier; a z-based p will be too small. Chi-square and F statistics need their own distributions. This p-value calculator handles z only.
Reporting results
Report the exact p-value, such as p = 0.032, rather than just “significant”, along with the test statistic, the effect size and a confidence interval. When you run many tests, some small p-values will appear by chance; adjust for multiple comparisons. Very small p-values are best written as p < 0.001.
Tips
- Compute z as (observed − expected) ÷ standard error.
- Enter a negative z for results below the mean when using the left tail.
- Decide the significance level, often 0.05, in advance.
- Pair the p-value with a confidence interval.
Getting z from your data
For a sample mean, z = (sample mean − hypothesized mean) ÷ (σ ÷ √n). Suppose a process should average 50 g with a known σ of 4 g, and 36 samples average 51.4 g. Then z = 1.4 ÷ (4 ÷ 6) = 2.1, and the p-value calculator gives a two-tailed p of about 0.036, below 0.05.
For study and planning only. Check lab, engineering and safety work against your course, instrument or a qualified professional.
Related converters and calculators
Related calculators:
- Z-score calculator: z from data
- Confidence interval calculator: intervals
- Sample size calculator: study size
- Standard deviation calculator: spread
Sources
NIST/SEMATECH e-Handbook: Normal distribution table; NIST/SEMATECH e-Handbook: Hypothesis tests.
Formula and method
Phi(z) = standard normal CDF. Two-tailed: p = 2 * Phi(-|z|). Left: p = Phi(z). Right: p = Phi(-z).
Double-precision normal CDF (Hart/West, error about 1e-14); tiny p shown in scientific notation. Default is two-tailed. Not a t, chi-square, or F p-value.
Questions about this calculator
What p-value does z = 1.96 give?
0.05 two-tailed, 0.025 one-tailed.
Is p the chance the null is true?
No, it assumes the null is true.
Should I use one or two tails?
Two tails unless the hypothesis was directional in advance.
Can I use it for t-tests?
Not for small samples; use the t distribution.
How accurate is it?
About 10⁻¹⁴ from a double-precision normal CDF.
Check the assumptions and units before relying on a result. Financial, tax and health estimates do not replace advice for your individual circumstances.
Report a calculation issue