
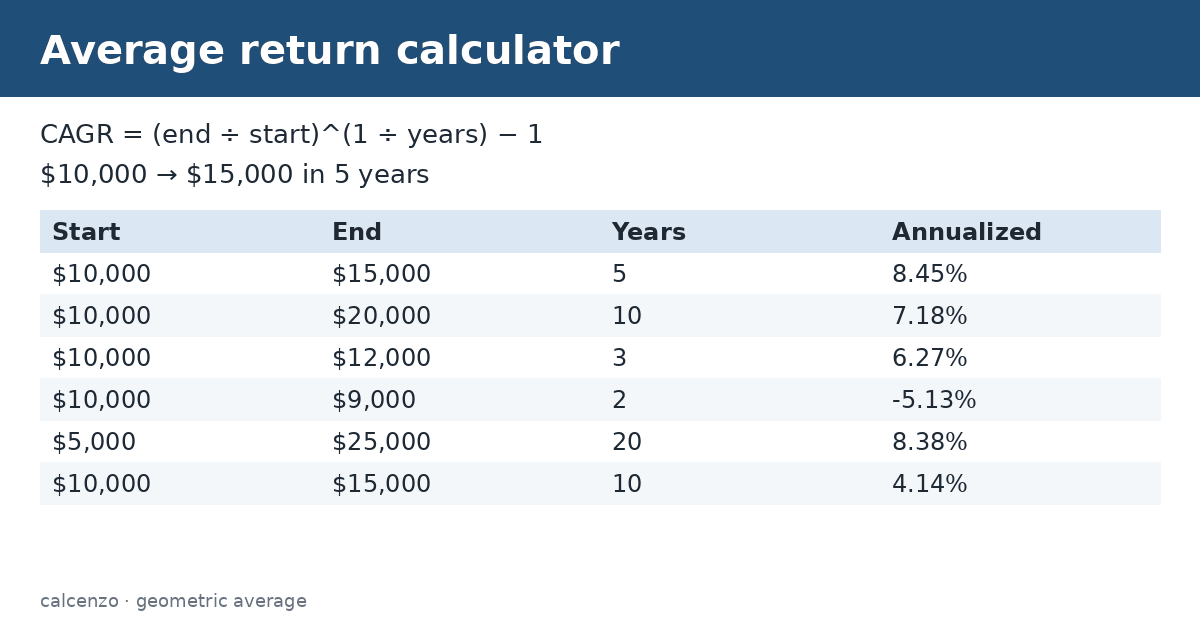
An average return calculator turns a starting value, an ending value and a number of years into the annualized return, the steady yearly rate that links them. Formula: CAGR = ((end / start) ^ (1 / years) – 1) x 100. $10,000 growing to $15,000 over 5 years is about 8.45% a year.
On this page
How to use the average return calculator
- Enter the starting value.
- Enter the ending value, including reinvested income.
- Enter the number of years.
- Read the annualized return.
What formula does the average return calculator use?
- Total return = ending value ÷ starting value − 1
- Annualized return (CAGR) = (ending value ÷ starting value)1 ÷ years − 1
The annualized figure is the steady yearly rate that would turn the starting value into the ending value over the period. It is a geometric average, which is the right way to average returns that compound.
Average return calculator worked example
| Start | End | Years | Total return | Annualized |
|---|---|---|---|---|
| $10,000 | $15,000 | 5 | 50.0% | 8.45% |
| $10,000 | $20,000 | 10 | 100.0% | 7.18% |
| $10,000 | $12,000 | 3 | 20.0% | 6.27% |
| $10,000 | $9,000 | 2 | -10.0% | -5.13% |
| $5,000 | $25,000 | 20 | 400.0% | 8.38% |
| $10,000 | $15,000 | 10 | 50.0% | 4.14% |
$10,000 growing to $15,000 over 5 years is a 50% total return. The annualized return is 1.51/5 − 1 = 8.45% a year, not 50 ÷ 5 = 10%, because each year’s growth builds on the last. Check: $10,000 × 1.08455 ≈ $15,000.
Arithmetic vs geometric average return
The arithmetic average adds yearly returns and divides by the number of years. It overstates what you actually earned when returns vary. Suppose an investment gains 50% one year and loses 50% the next. The arithmetic average is 0%, but $10,000 becomes $15,000 and then $7,500, a 25% loss. The geometric average, about −13.4% a year, matches that result. The more returns swing from year to year, the bigger the gap between the two, so use the geometric figure to describe past growth.
What to include
- Use values after fees, so the return is what you kept.
- Include reinvested dividends and interest in the ending value.
- If you added or withdrew money during the period, this simple calculation is distorted; a money-weighted return (IRR) handles cash flows.
- For periods shorter than a year, report the total return rather than annualizing it.
Using past returns
A past annualized return is a useful summary, but it does not predict future results. Markets have long stretches above and below their long-run averages. When projecting, use a cautious rate and test what happens with lower returns, especially for goals that are only a few years away.
Estimates for education only, not financial advice. Your lender’s figures are final.
Comparing two investments
Annualizing makes investments held for different lengths of time comparable. Suppose one fund grew from $10,000 to $15,000 in 5 years and another from $10,000 to $20,000 in 10 years. The second has the bigger total return, 100% against 50%, but the average return calculator shows that the first grew faster each year: about 8.45% against about 7.18%. Comparing total returns alone would have pointed to the wrong fund.
The same tool helps when checking a claim. If a product says it doubled your money in 6 years, the average return calculator gives about 12.2% a year; doubling in 10 years is about 7.2%. A quick rule of thumb that works well for rates between about 4% and 15%, the rule of 72, says money doubles in roughly 72 divided by the yearly rate in years.
Real versus nominal returns
The figures here are nominal, before inflation. To see growth in buying power, adjust for inflation: real return ≈ (1 + nominal return) ÷ (1 + inflation rate) − 1. An 8.45% annual return with 3% inflation is about a 5.3% real return. Taxes reduce the return you keep as well, unless the money is in a tax-advantaged account. For the clearest picture, run the average return calculator on after-fee values, then subtract inflation and the tax you expect to pay to see the growth you actually keep.
Related converters and calculators
Related calculators:
- ROI calculator: total return
- Compound interest calculator: growth
- Investment calculator: projections
- Inflation calculator: real returns
Sources
Investor.gov (SEC): Compound annual growth rate; Investor.gov (SEC): Compound interest calculator.
Questions about this calculator
What is the average return on $10,000 growing to $15,000 in 5 years?
About 8.45% a year.
Is average return the same as CAGR?
Here it is: the calculator gives the compound annual growth rate.
Why not divide total return by years?
That ignores compounding and overstates the yearly rate.
What is the difference between arithmetic and geometric returns?
The geometric average reflects compounding; the arithmetic average does not.
Does it handle deposits and withdrawals?
No. Use a money-weighted return for that.
Check the assumptions and units before relying on a result. Financial, tax and health estimates do not replace advice for your individual circumstances.
Report a calculation issue